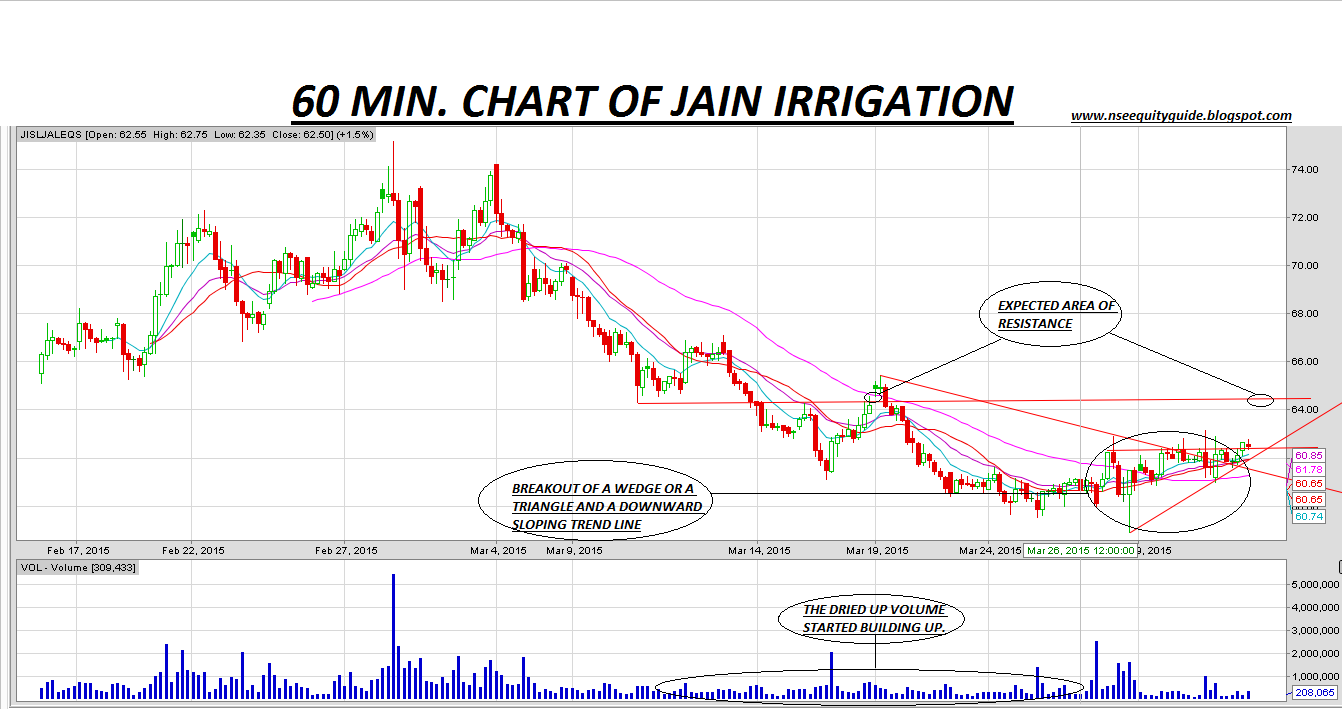
Shown above is the 60 minutes chart of Jain Irrigation. As we can see that in the last trading the stock has given multiple breakouts. A triangle or a wedge pattern breakout and also the breakout of a firm downward sloping trend line. The level 62.3 was stopped by the stock a couple of times in recent days making it as a strong resistance, but the stock has breached the level unlocking higher levels. Also we can the moving averages are lined up very nicely in a perfect bullish pattern holding the stock to give an upward thrust. In addition to the breakouts, the dried up volume off the stock has also started building with accumulation at lower levels. Therefore, I suggest to buy the stock for intraday targets of about 64.2 maintaining a stop loss below 61.60.


No comments:
Post a Comment